 Member Connect
World Backup Day 2016: Senior Data Backup Survey
World Backup Day happens March 31st. Did you know 47% of seniors never backup their most important data? Learn more insights from our backup survey!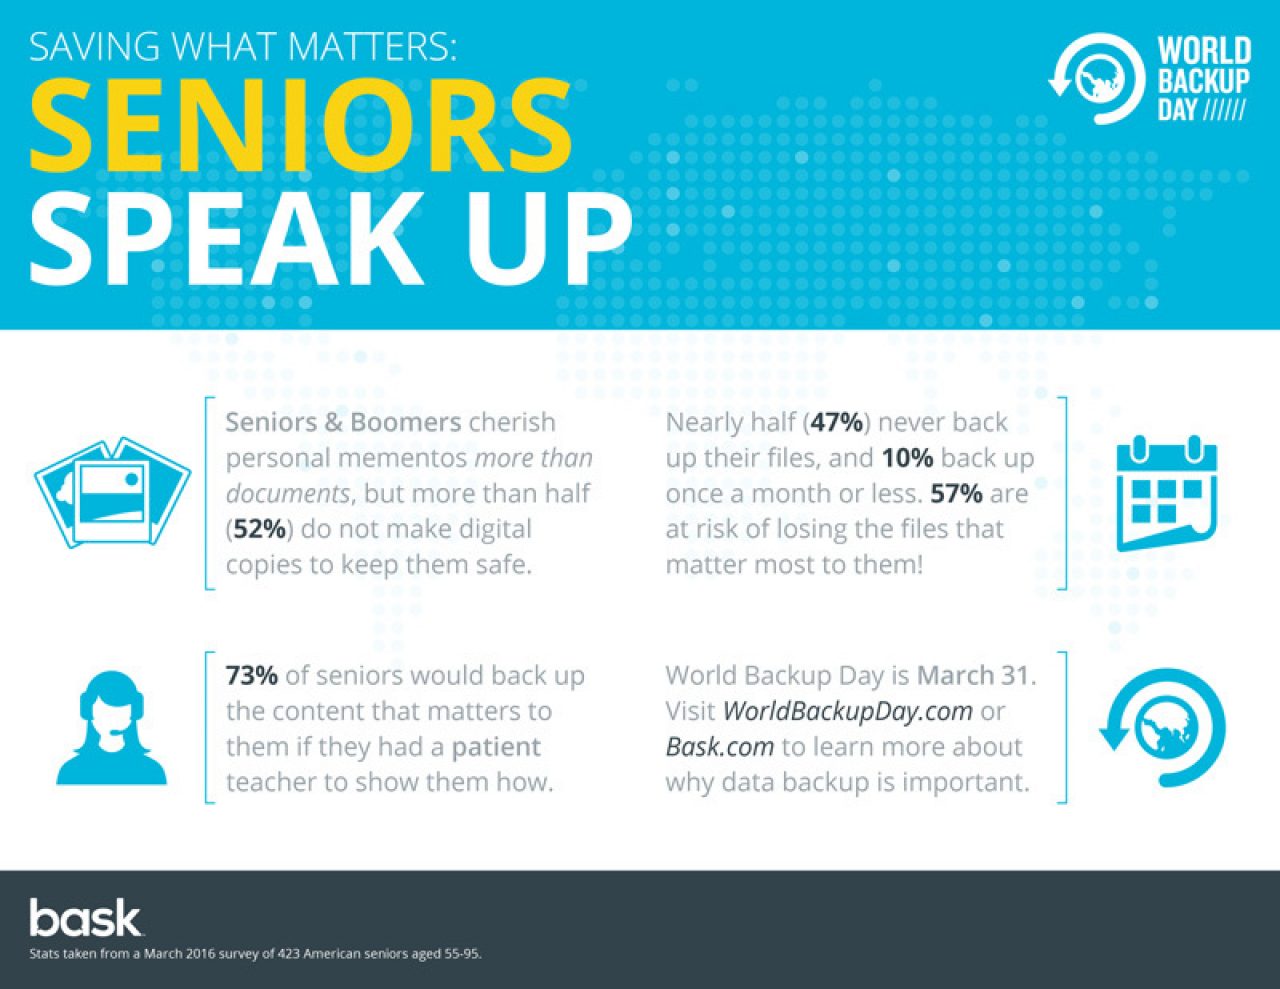
As you all likely know by now, at the end of this month, we're celebrating World Backup Day! While it's officially celebrated on March 31st, we've been talking about this exciting day, and why data backup is important, all month long.
To learn more about why our members use (or don't use) data backup, we put together a survey. The responses gave us great insight into common habits and attitudes surrounding backup! See our original infographic and the full survey results from 423 respondents below.

Click here to view a larger version and print this infographic!
Survey Q&As
Which of the following items would be most important to you to save?
- Photos / Videos - 36%
- Tax or Financial Information - 25%
- Personal Documents (e.g. birth certificates, letters) - 24%
- Music - 2%
- Recipes - 1%
- I don't have anything important enough to save. - 12%
Here's an interesting observation: When we segmented the responses by age group, different priorities emerged. While Baby Boomers choose photos as the most important items to back up (36%), older seniors of the Silent Generation choose personal documents (like birth certificates and letters). It seems that, when it comes to using technology, each generation has its own set of values!
Do you make digital copies of your important documents? (For example, do you scan, upload and save photos to your computer?)
- Yes - 48%
- No - 52%
Would you back up your documents and files if someone taught you an easy way to do it?
- Yes - 73%
- No - 14%
- I already know how to use backup. - 13%
How often do you back up files on your computer?
- Daily - 29%
- Weekly - 14%
- Monthly - 7%
- Yearly - 3%
- Never - 47%
How old are you?
- Under 45 - 1%
- 45-54 - 2%
- 55-64 - 9%
- 65-74 - 36%
- 75-84 - 42%
- Over 85 - 10%
What is your gender?
- Male - 43%
- Female - 56%
- Other / Prefer not to say - 1%
Thank you to everyone who answered our survey questions. We always appreciate your viewpoint and your time!